
Your offer against registered sales
Each dot is one registered sale. The shaded band is the middle half of prices.

Got an offer on a Dubai home? Check it against registered Dubai Land Department sales before you commit — free, in seconds. Or start with the 2026 real estate investment numbers.
Five ready and five off-plan projects with the strongest registered-sales picture on this method. The number is the median AED per sq ft.
This uses registered sales from 1 Jan 2026 to 30 Sep 2026. It ignores building, floor, view and condition. It is not a valuation. MNS Homez Real Estate L.L.C. may earn a fee if you later buy or sell through us. Full numbers, charts and method
This uses the numbers you typed. It ignores building, floor, view and condition. It is not a valuation. MNS Homez Real Estate L.L.C. may earn a fee if you later buy or sell through us.
Each dot is one registered sale. The shaded band is the middle half of prices.
The site is built in this order. Follow it, or jump to the step you are on.
Prices, volumes, off-plan vs ready, rents and the supply pipeline, month by month from DLD records.
Market pageFifteen communities on price, yield, sales and off-plan share. Pick the two or three that fit your budget.
Areas pageTest a quoted price against registered sales, then run costs, net yield, mortgage and IRR.
Check my offerBring your shortlist. We reply on WhatsApp with buildings, service charges and handover history.
Start a conversation
Each card: what the data shows, and what it means for you. All eight market charts →
The citywide median of new flat leases went from AED 72,000 in Jan 26 to AED 75,000 in Sep 26. Rent per sq ft went from AED 96.9 to AED 97.6 (+0.7%). Flats under 600 sq ft moved −6.2%.
So what: the citywide median is not one building. Underwrite the unit. If it already has a tenant, the rent can only move within the RERA rental index.
Source: Dubai Land Department open data, Jan 26–Sep 26 2026
Median ready-flat price per sq ft moved from AED 1,425 in Jan 26 to AED 1,373 in Sep 26. The months in between were uneven. Off-plan moved −7.8%.
So what: that is a lower entry than in January. Compare an asking price with ready sales of the same type. Off-plan launch prices are a different market. Use the registered sales band and set the status to Ready.
Source: Dubai Land Department open data, Jan 26–Sep 26 2026
Registered home sales went from 14,536 in Jan 26 to 9,593 in Sep 26. Off-plan was 75% of the year's total. This is the same year, not a comparison with 2025.
So what: September was quieter than the January peak, which is when buyers have more room to negotiate. It is not, by itself, a cut in the price of a finished home. Most of this year's sales were off-plan.
Source: Dubai Land Department open data, Jan 26–Sep 26 2026
Off-plan was 79,582 of 106,172 registered home sales from Jan 26 to Sep 26.
So what: a ready-flat gross yield is not the yield on an off-plan price. There is no rent until handover. Check the developer's delivery record and that payments go into the project escrow account.
Source: Dubai Land Department open data, Jan 26–Sep 26 2026
Every sale registered with DLD this year, by month. All market charts →
Flats, all registered sales, monthly
Number of registered sales per month
Each bubble is one area. Further left is a cheaper ready flat. Higher up means the yearly rent is a larger share of the price, before service charge. Bigger bubbles had more registered sales in 2026. Tap a bubble to open the area.
Fifteen communities on this shortlist, ranked from registered sales. Al Yelayiss 1 and City of Arabia are among the busiest sale areas in the same DLD file and do not have a page here. Filter, sort and compare all areas →
Registered DLD home sales. Bar length relative to the top area.
Where off-plan is 50% or more of 2026 sales, the first figure is the gross yield at the median sale price, the price people are paying, and the ready-flat yield is the second figure. Otherwise the figure is the ready-flat yield. Before service charge, vacancy and management. Dubai South is 4.9% at the sale price and 7.6% on ready flats.
 53% off-plan
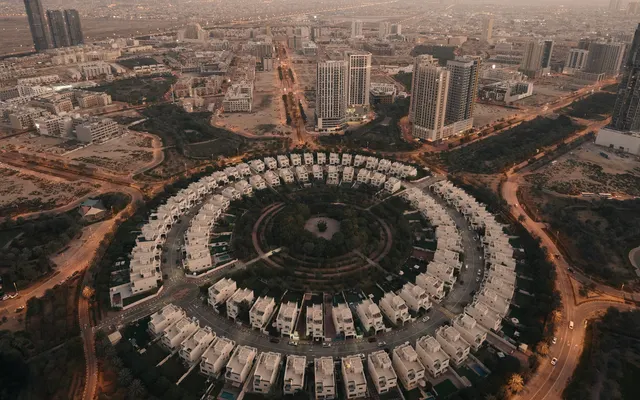 57% off-plan
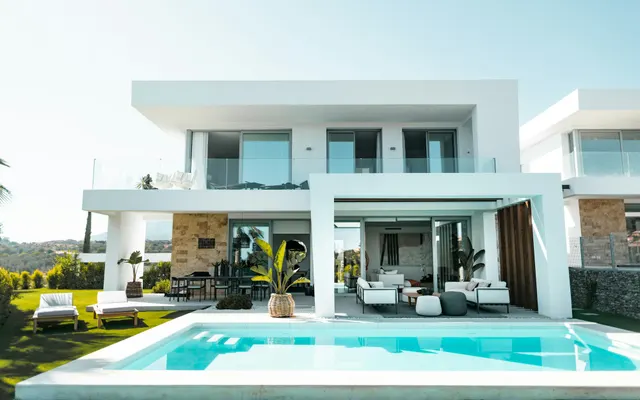 54% off-plan
Free, no sign-up. Your inputs stay in your browser.